![]()
Verifying a vector network analyzer (VNA) has been calibrated properly is not a trivial task. Just measuring the calibration standards gives you an idea of repeatability, but does not prove the calibration has been performed correctly. Commercial VNA verification kits are available for this purpose, but these are very expensive, as they contain precision airlines like in the photograph below, which shows the two airlines from an HP 85053B verification kit. At the time of writing, (June 2018), the Keysight 85053B verification kit costs $8620 (USD).
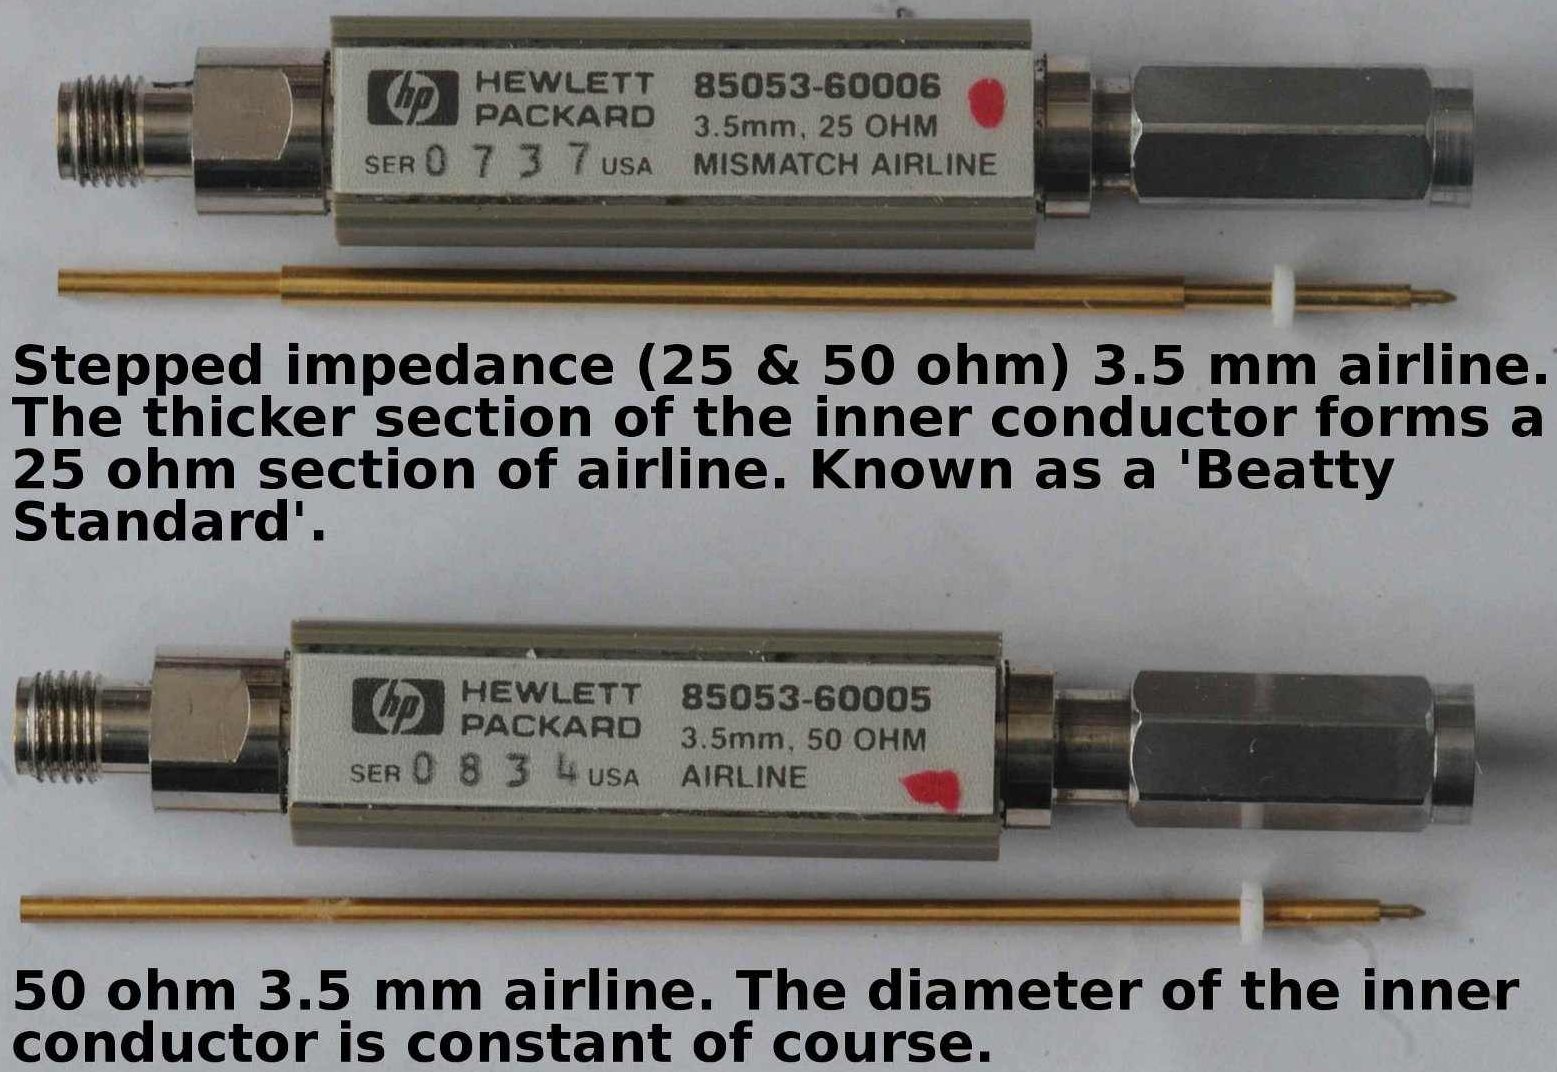
In addition to the two airlines, the HP/Agilent/Keysight 85053B verification kit contain two attenuators, with data measured by the manufacturer. The data is in a format designed to be read by a VNA, not a human.
Although airlines are the best devices to verify the calibration with, it is impossible to produce precision airlines and put them in a low cost kit. Airlines are also very delicate, and need handling with lint free gloves. However, Kirkby Microwave do provide some ways to verify performance in their calibration and verification kits. It is highly recommended that you perform these verification steps after the VNA has been set up to use the kit, in order to verify that everything is set correctly. The attenuator supplied in the N and SMA kits is not the most rigorous test of a calibration, but it useful, which is why it is included.
Having the correct coefficients loaded into the VNA is critical, yet sometimes people enter them incorrectly. The following procedure will detect some errors. If possible, to ensure maximum stability when doing these tests, do not use any cables, but use adapters to connect to the VNA.
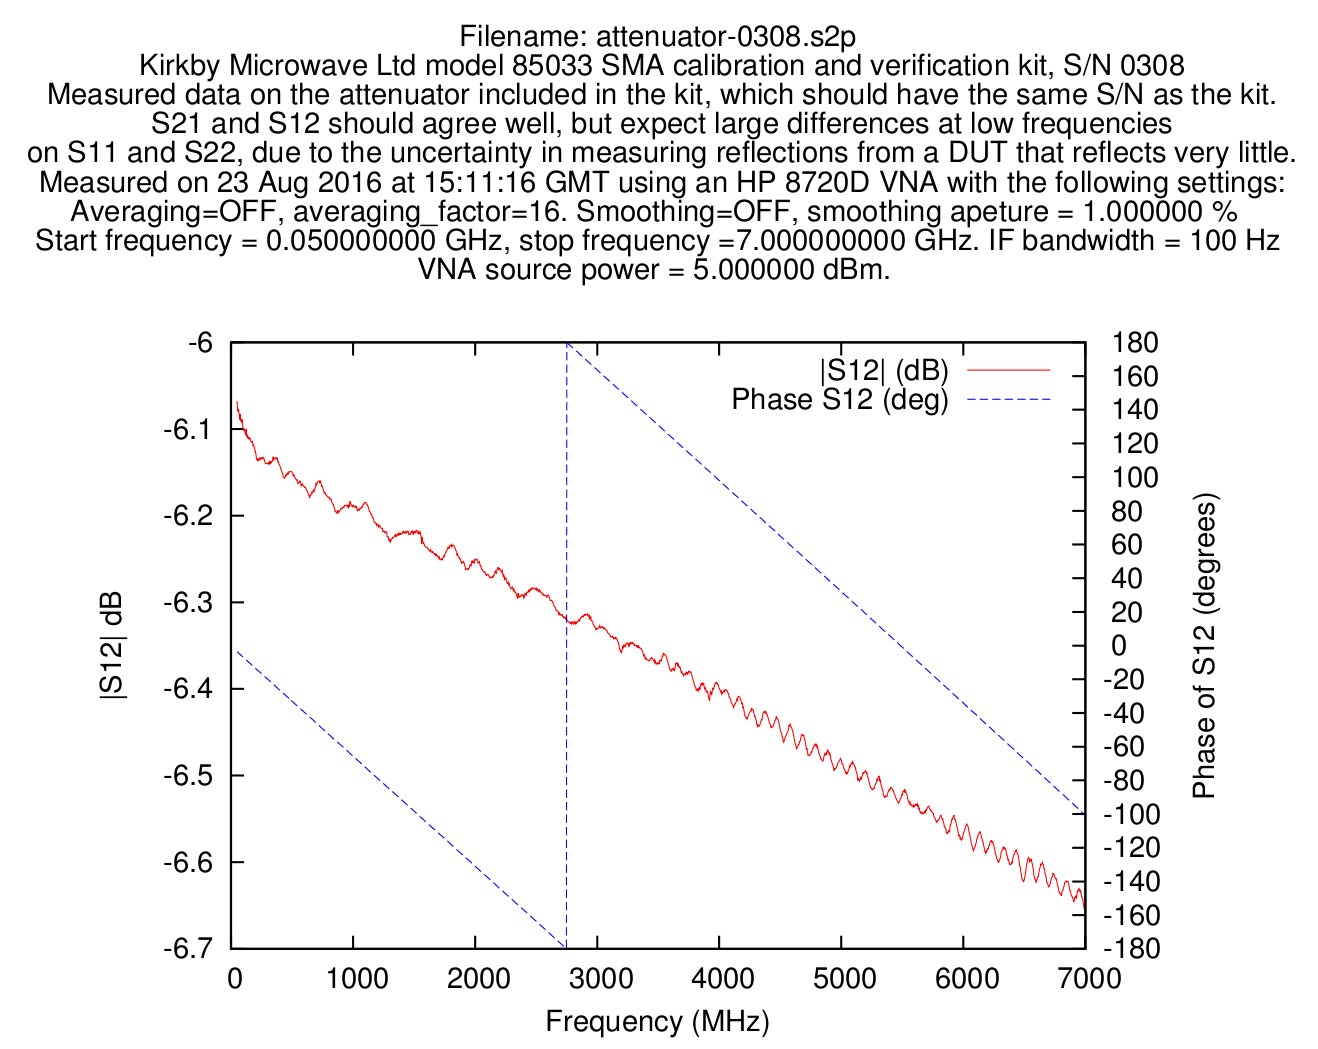
After using one of our kits to calibrate your VNA, it is sensible to check the VNA is giving good results. A failure to give good results indicates either a fault in the VNA or an error in uploading the coefficients properly. Unlike calibration kits from other manufacturers, all our coaxial kits include a fixed attenuator with measured data. The data will be found on a USB stick included with your kit in the directory "Measured_data_of_attenuator". If you get similar results to what's shown on the USB stick, there is unlikely to be any serious problems. You should get good agreement on S21 and S12, but do not expect good agreement on S11 or S22, since the return loss of the attenuator is high, so the measurement uncertainty is high.
Note the aim of the verification attenuator is not to prove your VNA is within specification - if you need to know that, send it back to the manufacturer, and not a third party lab. But the attenuator will give you a good idea if there are any serious problems.
This procedure is applicable to our N and SMA kit. Some parts can only be performed on the N kit, and some only with the SMA kit but most can be done with either kit.
The data measured by Kirkby Microwave will be placed in a .s2p Touchstone file. This will have the name attenuator-xxxx.s2p, where xxxx is the serial number of the calibration and verification kit. It will have the measured data on all 4 S-parameters. PDF plots of the data are also provided for the convenience of the user, although it is easy to plot them yourself, once you understand the .s2p Touchstone format. (An understanding of Touchstone files is essential if you intend making any serious use of a VNA.) You can plot the data using OpenOffice, Microsoft's Excel, or any other software capable of producing graphs. Kirkby Microwave use Gnuplot since it allows one to create files without user interaction.
4 graphs (one for each S-parameter). Each graph has two y-axes, since two sets of data (magnitude and phase) are shown. As stated earlier, measurements of S11 and S22 are subject to very high uncertainty, so whilst these are provided, they are of limited use.
One should perform the following steps to ensure the the transmission data you measure matches that measured by Kirkby Microwave:
If you measure S11 or S22 of the attenuator, and compare the data to that supplied, you will find poor agreement. This is because the attenuator is good quality and reflects very little power, especially at low frequencies. Therefore the measurement uncertainty of S11 and S22 will be high. Also, movement of cables is likely to cause changes in magnitude and phase far in excess of those of the attenuator itself. Because of the problems in using S11 and S22 data of the attenuator, a revised set of data was provided by Kirkby Microwave on some kits shipped after August 20th 2016.
The following is applicable if using either a 1-port VNA, or a VNA with 2 or more ports, but making 1-port measurements.
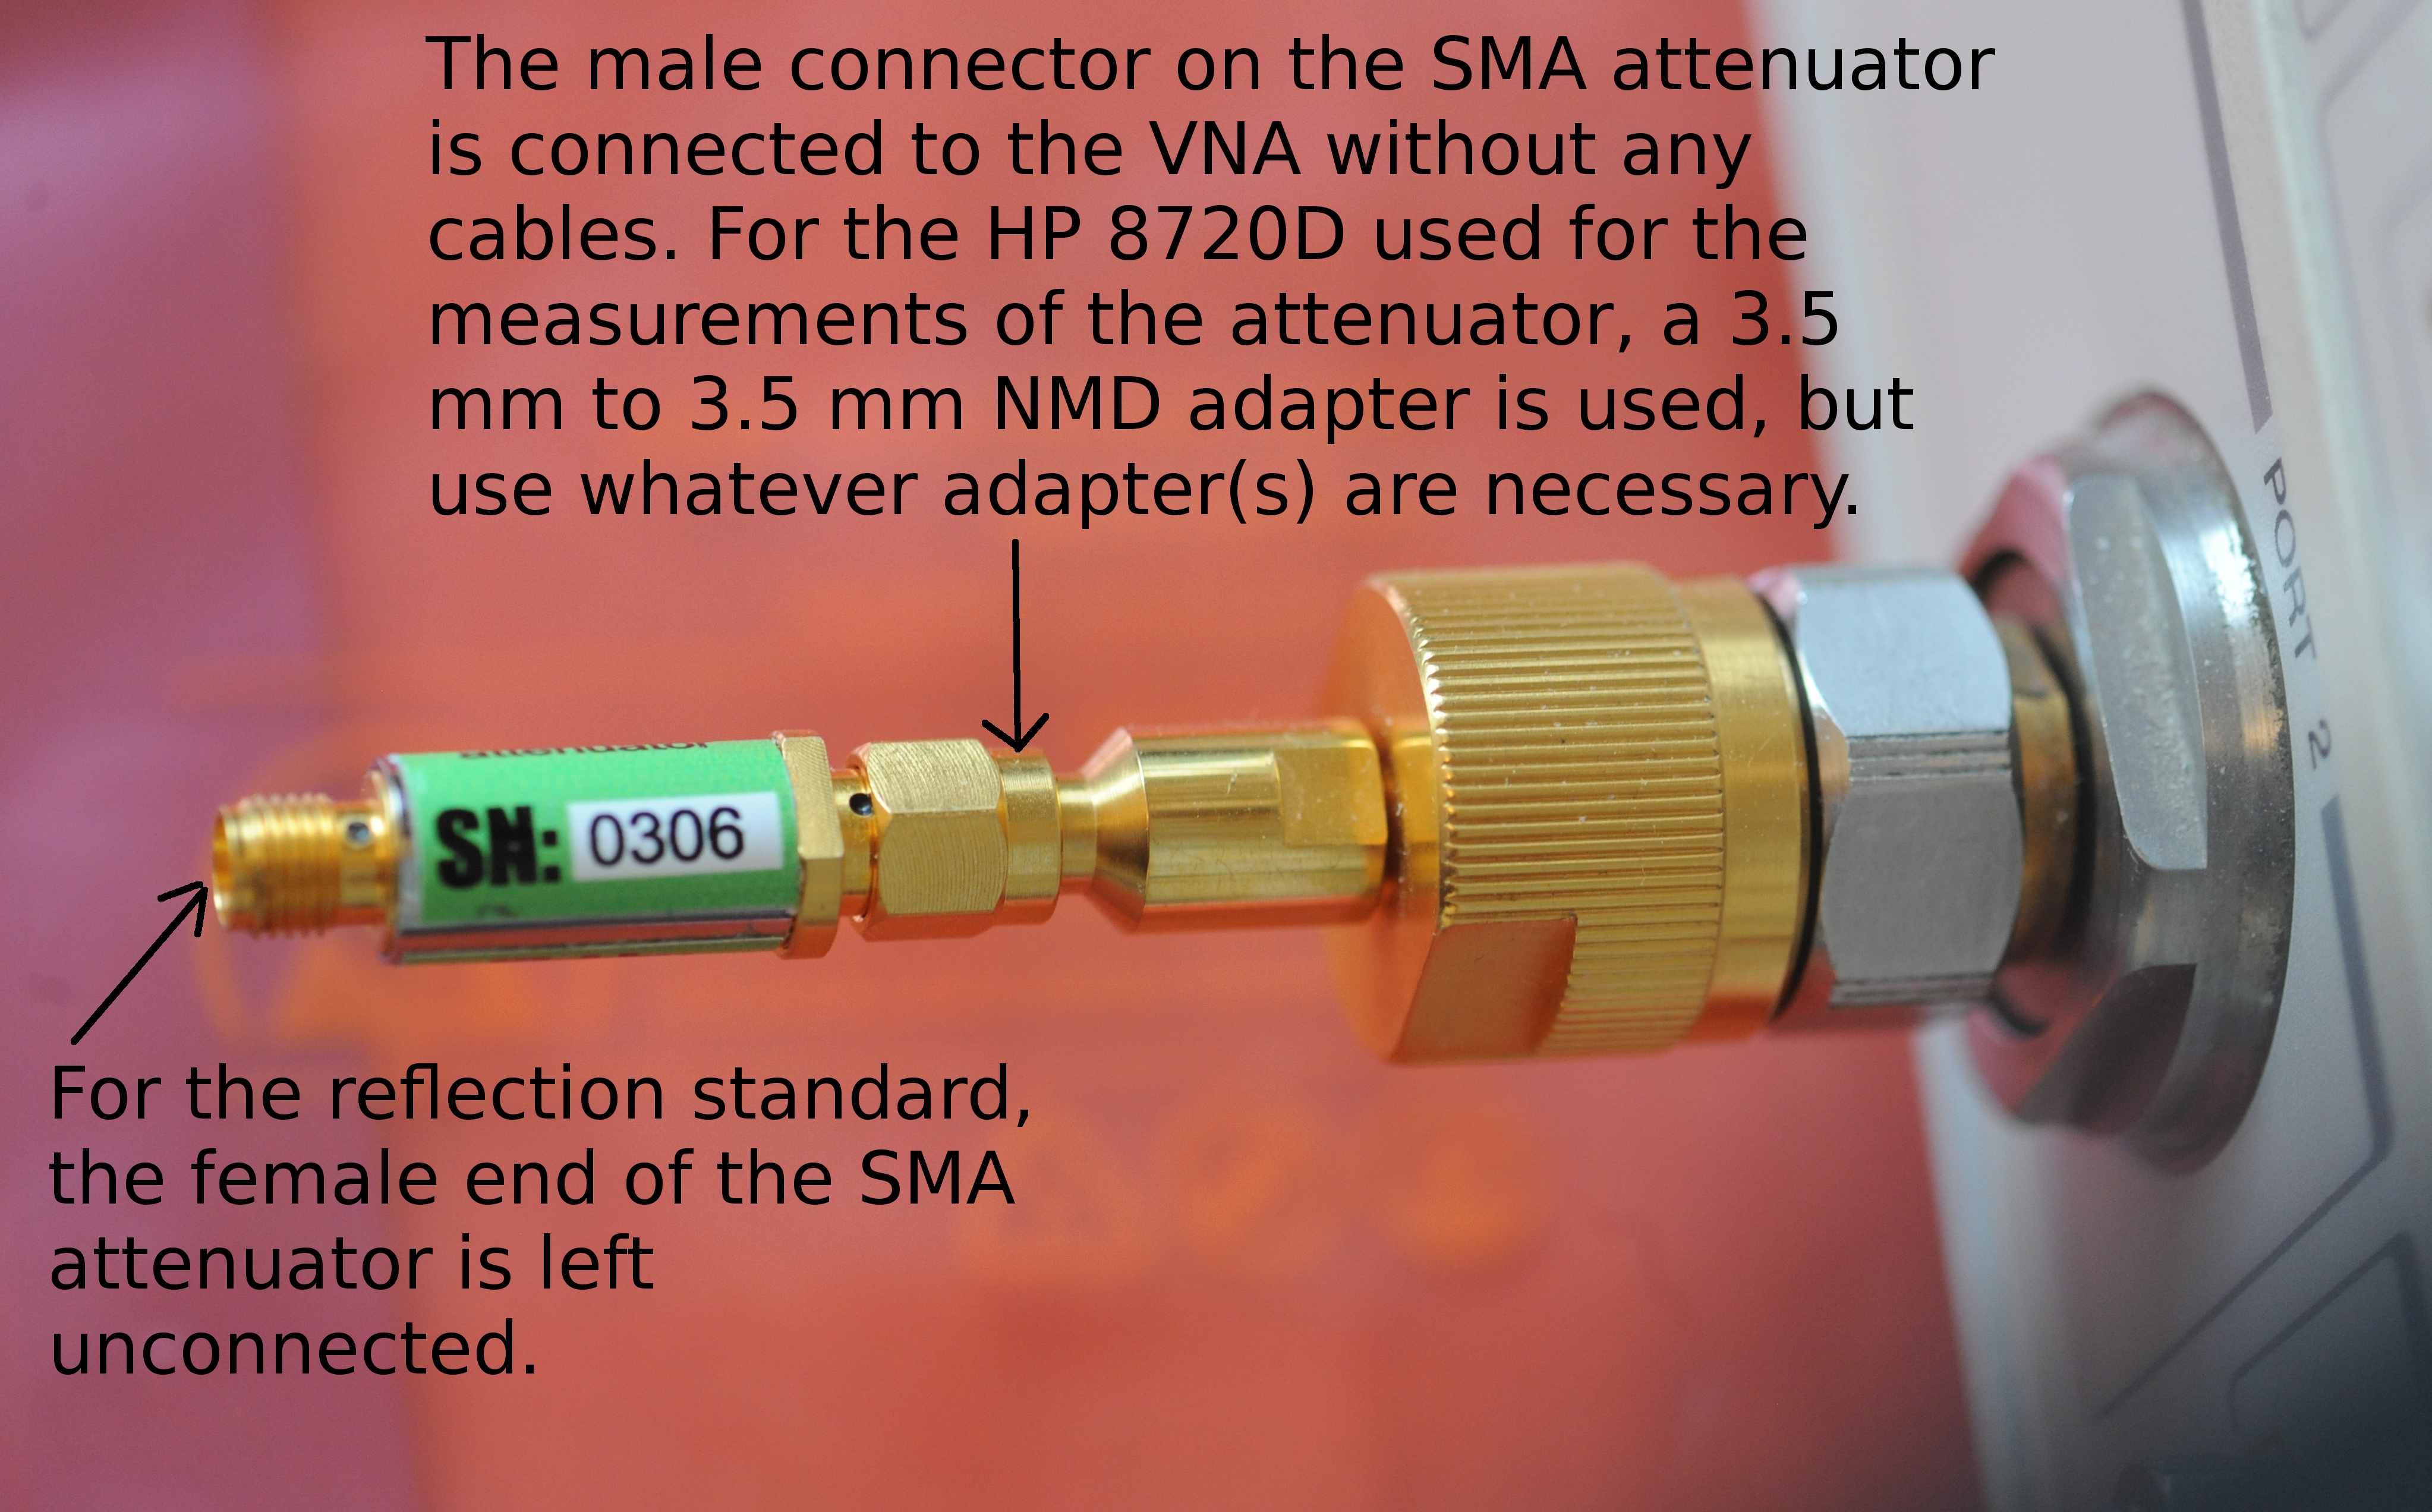
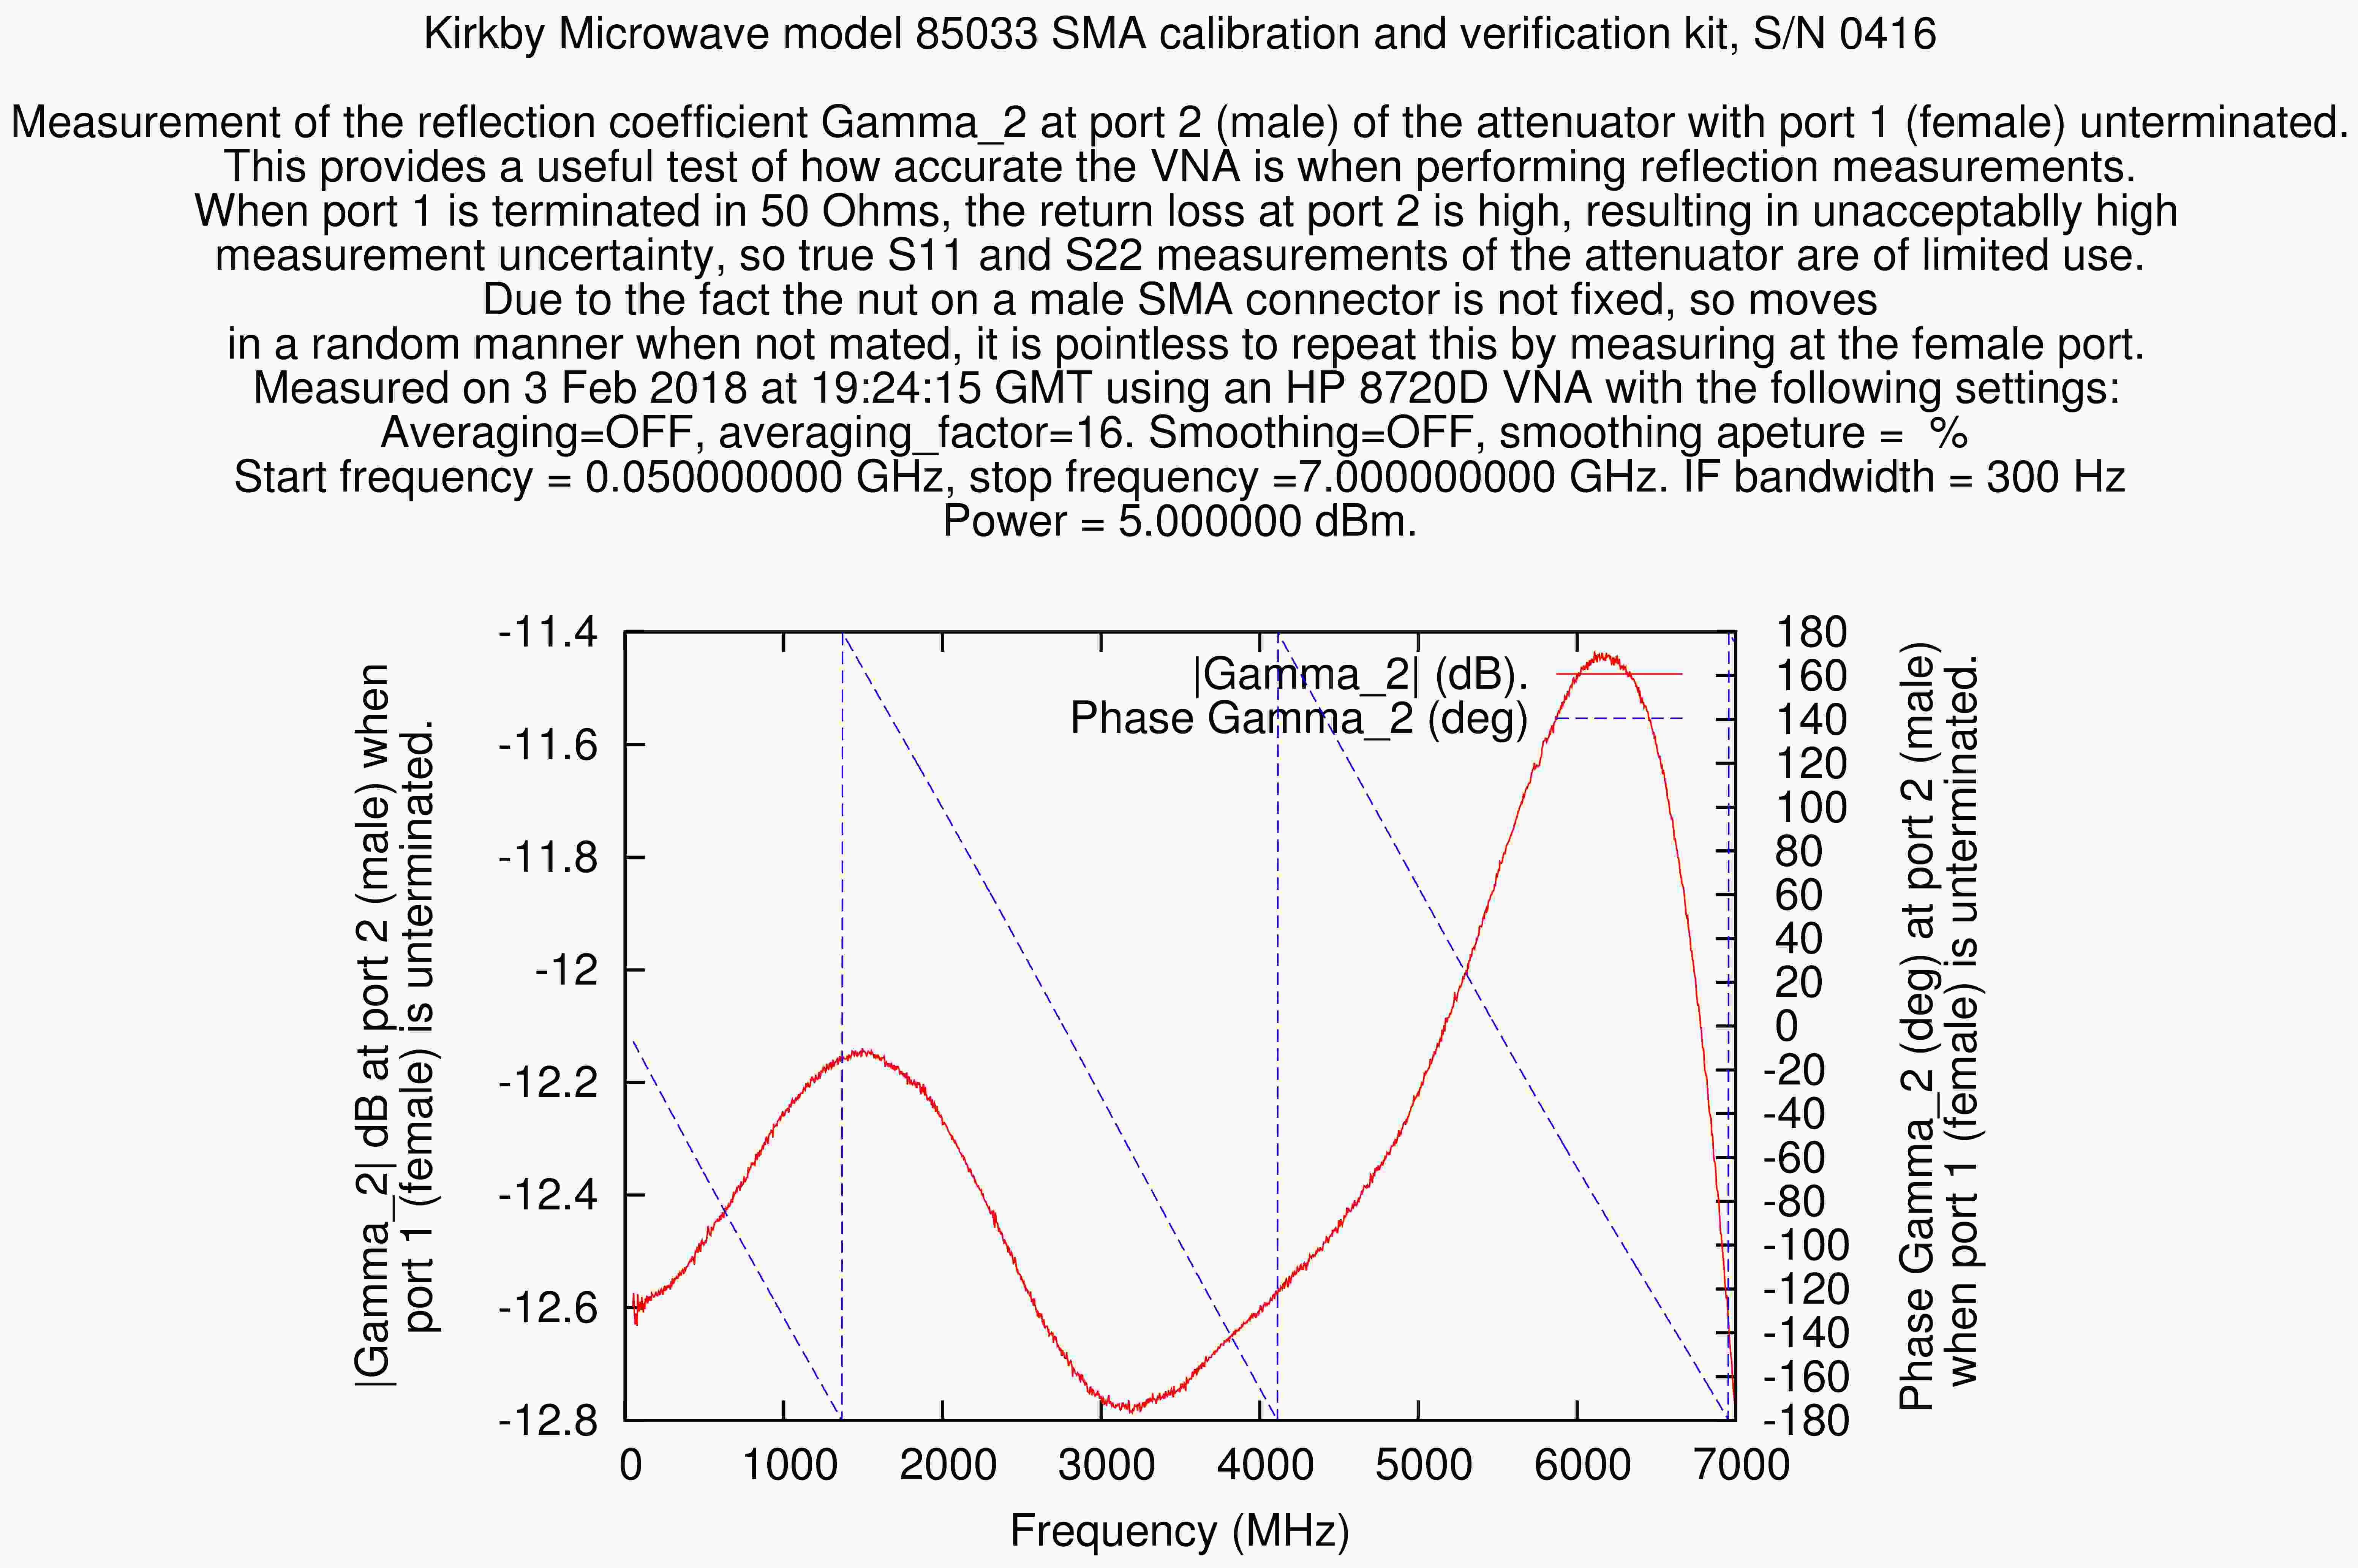
As stated above, the high return loss of the attenuator means measurements of S11 and S22 of the attenuator are subject to very high measurement uncertainty. For this reason, measurements of S11 and S22 do not provide useful information. We have developed a reflection standard, allowing 1-port measurements of reflection without excessive uncertainty. We measure the following two setups.
A similar test can be performed with the attenuator turned around. These makes very useful tests in reflection mode.
The USB stick will contain 4 files for these measurements. For an example, if the S/N of the kit is 1234, the files will be:
These measurements at one port, with the other port left open, are made without any cables in the system, so the attenuator connects to the VNA only via adapters, which are electrically more stable than any cables. For measurements of transmission (S21 and S12), it is impossible to avoid using cables, although for best accuracy, only one cable could be used.
One should perform the following steps to ensure the data you measure matches that measured by Kirkby Microwave:
Kirkby Microwave Ltd is registered in England and Wales, company number 08914892. Registered office: Stokes Hall Lodge, Burnham Rd, Althorne, Essex, CM3 6DT.